


The 2007 Report The Social Economy in the European Union edited by the European Economic and Social Committee highlights that approximately 6.9% of the total paid employment (aged 16-65) in Belgium works in the non-profit sector. Figures for cooperatives, mutual societies and associations are the following:
– co-operatives: 17,047 employees;
– mutual societies: 12,864 employees;
– associations: 249,700 employees,
for a total of 279,611 paid employees (2002-2003 data).
Hence, associations employ approximately 90% of the total workforce active in the whole social economy, as also reported by a study by Defourny and Pestoff (eds.) titled Images and Concepts of the Third Sector in Europe (2008).
According to data by the Institute des Comptes Nationaux, in 2004 the number of paid staff employed in non profit institutions increased to 368,300 units, corresponding to 10.5% of the whole paid workforce in Belgium.
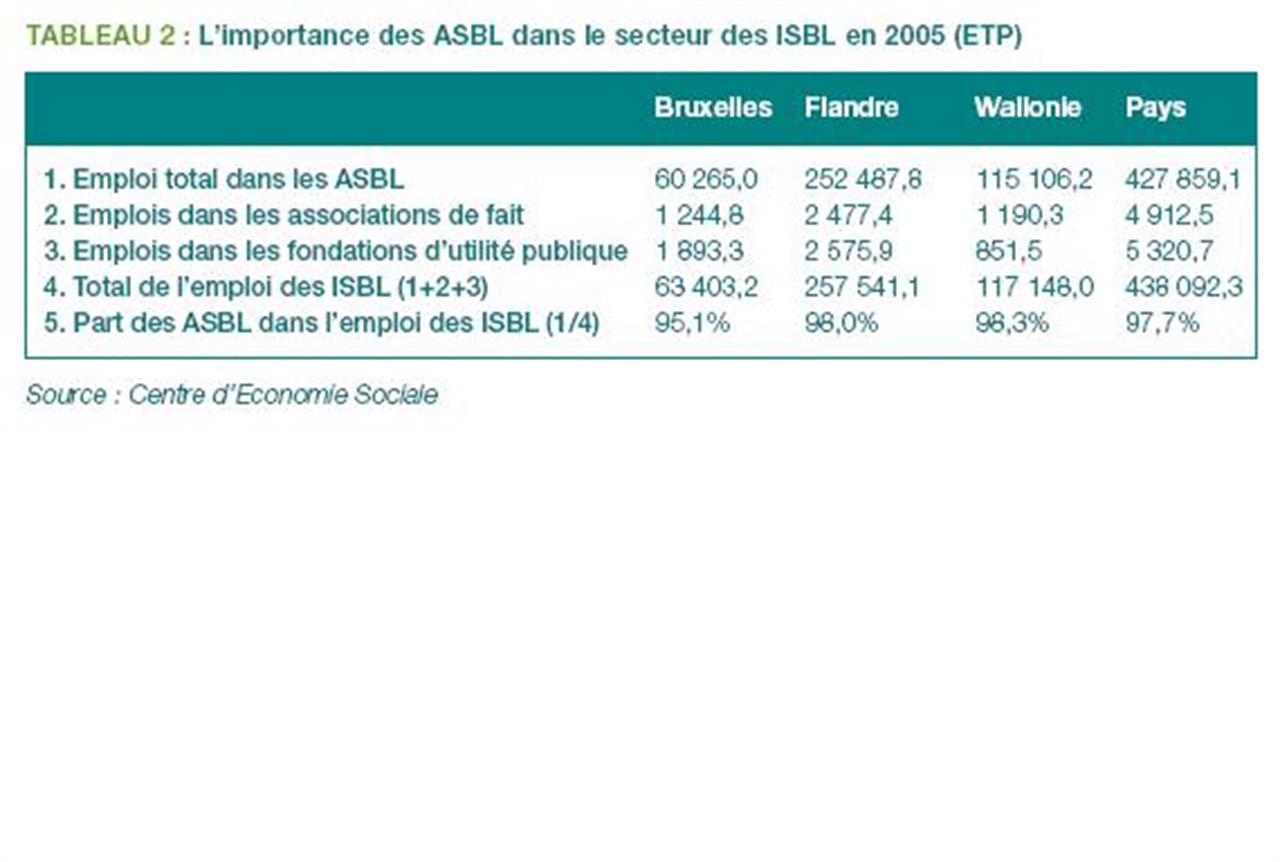
For 2005-2006 the corresponding figures are the following (Centre d’Economie Sociale, HEC – ULg): 311,707 are the wage-earning employees in the social economy (schools and hospitals in form of associations excluded), corresponding to 8.8% of the Belgian workforce. Expressed in Full Time Equivalent (FTE), they amount to 236,292.9 workers, the 8.0% of the total workforce.
If we consider the schools and hospital in form of association, too, paid staff amounts to 589,517, that is: 16.7% of the workforce in Belgium.
|
Chiffres-clés des ISBL (2004) |
||
|
Nombre d’ISBL |
16 913 |
|
|
Nombre d’emplois salariés |
368 300 salariés |
soit 10,5% de l’emploi salarié du pays |
|
Production |
22 173,6 millions d’euros |
soit 3,7% de la production du pays |
|
Valeur ajoutée (VA) |
13 285,1 millions d’euros |
soit 4,6% de la VA du pays (PIB) |
|
Coûts de production |
21 623,5 millions d’euros |
soit 4,0% du total de l’économie |
|
Ressources courantes |
23 415,0 millions d’euros |
soit 3,1% du total de l’économie |
|
Investissements |
1 564,6 millions d’euros |
soit 2,8% des investissements du pays |
Source : Institut des Comptes Nationaux
|
L’emploi salarié dans l’économie sociale (2005-2006) (*) |
||||
|
Nombre d’entités |
Nombre d’employeurs |
Nombre de salariés |
Nombre d’ETP |
|
|
|
|
|
|
|
|
Associations |
– |
17 006 |
564 497 |
443 025,3 |
|
|
|
|
|
|
|
Mutuelles (unions nationales) |
5 |
5 |
12 864 |
11 230,0 |
|
|
|
|
|
|
|
Coopératives agréées CNC |
551 |
165 |
6 750 |
5 662,3 |
|
|
|
|
|
|
|
Sociétés à finalité sociale |
457 |
297 |
5 406 |
4 265,0 |
|
|
|
|
|
|
|
Total Economie sociale |
– |
17 473 |
589 517 |
464 182,6 |
|
En % de l’emploi du pays |
16,7% |
15,7% |
||
|
Moins écoles et hôpitaux en ASBL |
|
|
– 277 810 |
– 227 889,7 |
|
= Total ES hors écoles et hôpitaux |
|
|
311 707 |
236 292,9 |
|
En % de l’emploi du pays |
|
|
8,8% |
8,0% |
Source: Centre d’Economie Sociale (HEC – ULg).
(*) Les données relatives aux mutuelles concernent 1998 et 1999 et feront l’objet d’une prochaine mise à jour.
For associations (Associations Sans But Lucratif, ASBL) see also tables in attachments.
Cosa fa VITA?
Da 30 anni VITA è la testata di riferimento dell’innovazione sociale, dell’attivismo civico e del Terzo settore. Siamo un’impresa sociale senza scopo di lucro: raccontiamo storie, promuoviamo campagne, interpelliamo le imprese, la politica e le istituzioni per promuovere i valori dell’interesse generale e del bene comune. Se riusciamo a farlo è grazie a chi decide di sostenerci.